Hims & Hers - Road to profitability
LTV vs Acquisition cost for a DTC Brand
H&H is one of the successful DTC brands in the US, selling products & services around health to their subscribers.
Revenue forecast for FY '22 is at approx. $500M (annual revenue), with a focus on constantly increasing LTV as well as subscriber base. Full year EBITDA margins are expected to be negative. Growth for the next few years is forecasted by the management to be around 30% (YOY).
The brand had an IPO in 2019, via the SPAC route, managed by none other than Howard Marks & Oaktree Capital Management.
While the brand might be showing bigger numbers in terms of revenue, their FY’24 profitability aim relies on reducing their operational costs.
DTC brands have largely been working on few common things to improve profitability and revenues, and is also the case with H&H
Increase in customer retention
Increase in AOV
Increase in LTV
Economies of scale with the 3rd party manufacturers
Economies of scale in operations
But with $500M of annual revenues, one would have thought that the brand would have solved the 5 problems, but even now the profitability/ positive cash flows are at least 6 quarters away.
This is the case with almost all DTC brands, where scale has not led to profitability.
H&H share value has decreased by almost 35% since the issue. All birds are almost 90% down from its listing price.
Hims & Hers Health Inc (H&H) concluded its 3rd Quarter results last month, and had some great learnings for a DTC enthusiast.
Most smaller companies don't look at cash flows and cost of operations, even while working on a niche market. A dollar saved in operations can be used to better customer retention and improve the LTV for a brand.
Summary
Current Challenges for H&H
Increase the Revenue of the brand
Make the company profitable by FY’24. This has been committed by the management in the last Investor’s call
Maintain positive operating cash flows.
Why is it hard?
The company has an EBITDA loss of approx. 16% for 9 months FY’22 (vs. Loss of 50% last year)
Current Marketing expense is more than 52% of the revenues. Cost of acquisition of customer at $520 (Increase in subscribers/Marketing expense).
Company focuses on subscriptions of Healthcare products.
Current LTV (for 3 years) is between $540-$600 based on the last data shared by the company in 2021. Gross Margin Contribution between $416- $462, barely covering even the cost of acquisition.
Hard to sustain subscriptions for more than a year. The Brand is diversifying its portfolio and adding more products to sustain and increase its LTV.
This strategy, while good, has an adverse impact on the cash flows. Sales turnover ratio (COGS/Sales) has increased from 32 days to 58 Days in the last 2 years.
The brand plans to increase the revenue from subscriptions to cover marketing costs to acquire the customer in Year 1 (i.e. Revenue from Subscriber for 1st year > Cost of acquisition of the customer, by FY’23).
Bringing down Opex cost - Last year the company decreased the opex cost by almost 60%. Can be worked on further.
Takeaways
Discontinue Non performing products:
E-commerce operates on the pareto principle, where 20% of the products give nearly 80% of the sales. Testing and introducing new products has to be the DNA of any new brand, but also needs to be worked upon identifying products which do not generate operating cash flows.
The company needs to weed out non performing SKUs, to manage its cash flow situation.
However, this is easier said than done. Complimentary products may increase the AOV but are a hard sell, individually.
But this would help in :
Reducing operating working capital
Reduce the expense on marketing, since mast low selling products also doesn't give good ROAS.
Increase the AOV
Reducing operational expenses cost
Increasing the first year revenue to cover the customer acquisition cost. With a 22% increase in current AOV this can be done.
Optimizing marketing expense:
Currently the majority of the expense seems to be on HIMS, the brand focused on males.
Much reliance on paid marketing
Currently as per the ads on Facebook by the brand - most focus is on selling Viagra.
Optimize Operational expenses:
The brand needs to further work on the operating expenses. For eg. The brand has spent around $10M on App, website & Internal software in the last 3 years. As a percentage of revenue this is approx. 2.5% - 3% of the revenues, which is quite high for such a large base.
About the Brand & Financials
Company Listed in 2019. The company has raised $340M via SPAC arrangement with Oaktree and thereafter listing at the stock exchange. All the investors, prior to the IPO have continued to roll their equity shares.
Cash from Financing (Funding and IPO) has been consistent during the past few years.
Currently the revenue is from DTC healthcare products like Erectile Dysfunction, Sexual Wellness, Hair Loss, Mental Wellness and Acne treatment.
Valued at 1.37 Billion, Market Valuation down by 33% since the listing. Price to Sales ratio is approx. at 3.
90% of the orders by the Brands are subscriptions on App or website.
Marketing cost is approx. 52% of the revenues, translating to conversion of each subscription at approx. $476, over the last 2 years on an average.
$100 Revenue P&L of the company (Both Online & Wholesale):
(Source 10K filings by the company)
For the last 3 years the Model $100 Revenue table for the company stands as below.
(Source 10K filings by the company)
Cash losses - have decreased in 2022 vs 2021, from $34M to $19M (although the loss for 2022 accounts for only 9 months, but as in #8 , the brand has made significant improvements in Ops, Tech & HR admin costs).
Gap in P&L losses is mostly on account of stock based compensations. This is largely the result of an increase in stock-based compensation related to the earnout consideration and other one-time costs that stem from IPO.
The company has approx. $198M of cash reserves, $13M have been committed to M&A in Q4’FY22
Revenue has increased by 92% but the marketing cost has also increased by 100%. Marketing cost as percentage of revenue has increased.
The brand has posted a loss of $57M losses (16% of Revenue) down for 9 Months of FY’22 from $93M (50% of Revenue) for the same period last year.
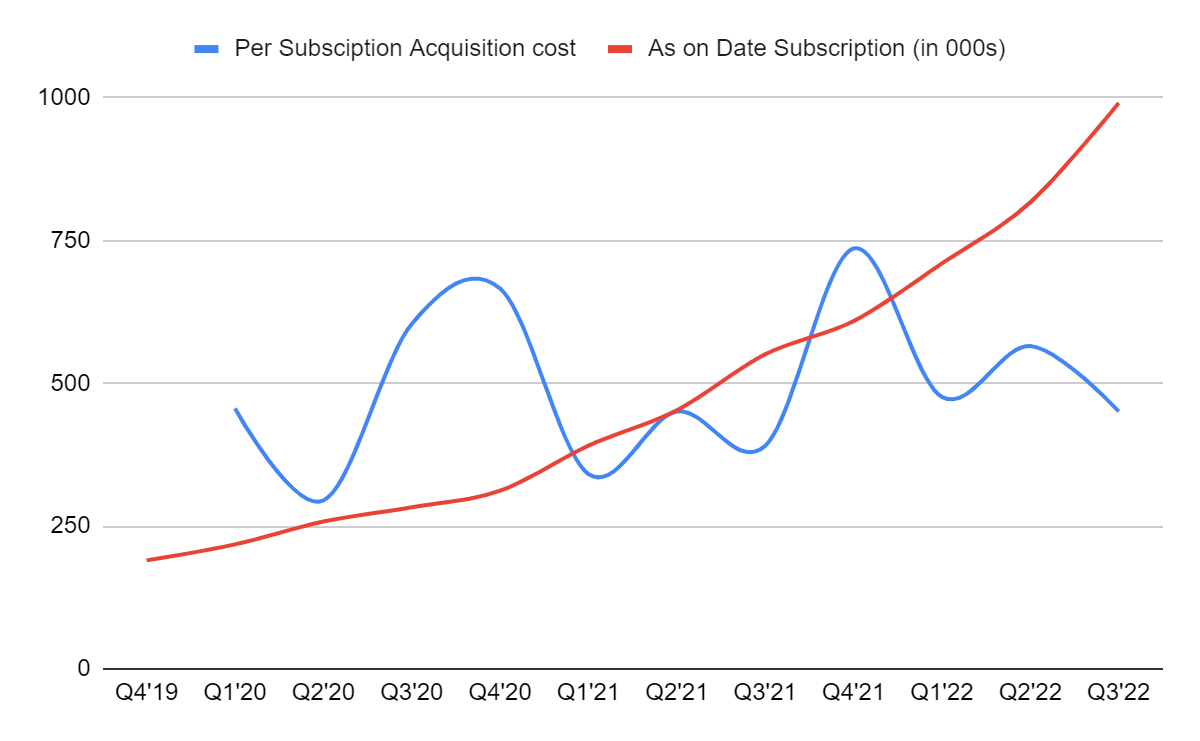
Marketing cost has increased with the Subscription base over the years. Seeing both the charts, it is very hard to assume that the word of mouth or organic customer acquisitions is significant. This is the problem even the large DTC brands are also facing, punching the theories of “Network Effect” right in the face.
The company has not shared gross increase with fall out in subscriptions, but looking at the increase in marketing cost with increase in net subscriptions- looks like, it is increasingly hard to maintain the current subscriptions and acquire new ones.
Marketing Cost over the last 2 years
Source - Last 3 years Investor Results
Since 90% of the revenue comes from Subscription, acquisition cost of subscribers remains the same through the years, although cyclical.
Network effects of an app or subscription should have been visible by now since the company claims to have almost 1M subscriptions as on date.
P.S. CPM rates are the highest in Q4 and hence the subscription acquisition costs remain the highest.
Source - Last 3 years Investor Results
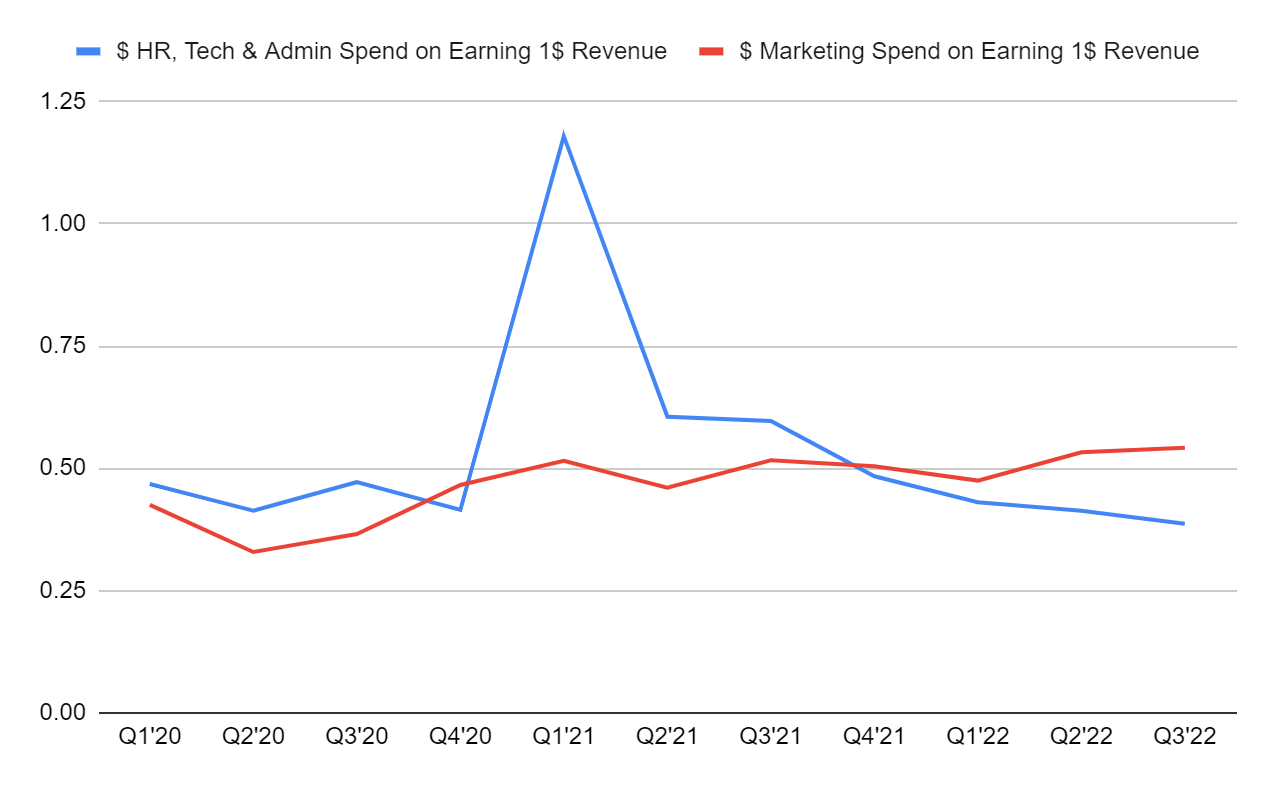
Cost of marketing spend per $ earned remains as high as always during the last 2 years. Again, demonstrating network effect remains somewhat far-fetched.
Source - Last 3 years Investor Results
Checked the investor guidance and presentation for the brand for the last few quarters. After June 2021 the company hasn't shared any data on LTV.
The last data shared where the brand was projecting between $540 - $600 as the cumulative revenue generated by the subscriber in 3 years post 2020.
Considering that for the last 2 years, the average customer acquisition cost has been north of $500, there is little margin available for the Brand, post spending on marketing & customer acquisition.
P.S. - The word LTV was not mentioned in the last 3 Earnings Calls :)
Source - Q2’21 Investor Presentation
The approach of adding more categories and products has a flip side - Inventory turnover. While the LTV has increased in the past few years, so has the inventory.
Inventory turnover has increased from 30 days to 60 days in 2 years, increasing the working capital requirements.
Last few quarters have seen the HR, Admin and Tech costs coming down as a %age of revenue earned.
Looking at the chart below, the brand has not been able to bring down the marketing cost on per $ Revenue earned, but has brought other costs significantly.
Source - Last 3 years Investor Results
Company’s Q3’FY22 earning presentation also gives similar details
Source - Q3’22 Investor Presentation
The company can look to reduce expenses further, for eg the total investment made on website development and internal software’s has been close to $9,991K (approx. $10M).
Future Outlook
Source - Q3’22 Investor Presentation
Looking at things holistically, the brand has 4 targets to increase revenue, contributions and improve margins. All of them are co-related.
Increasing product portfolio & Category Expansions
The Strategy has worked very well for the brand. It has helped in increasing the retention as well as higher AOV (Average Order Value) for the brand. AOV has increased from $53 to $80 in the past 3 years.
Better retention / Improved Cost of Operations/ Improved Marketing Matrices
Source - Last 3 years Investor Results
On the flip side, this has also increased the working capital for the brand. The brand might need to weed out the non performing SKUs and concentrate on the winners. As shared earlier, this might be a very difficult thing to do as complimentary products may be pushing the AOV but are a hard sell individually.
Increasing subscription base - helps in increasing LTV
With a focus on newer categories the brand has also targeted to reduce the payback period on marketing spend on subscriptions to less than one year.
As shared in Pt. 11, the company last shared its LTV data in Q2 '21, where the revenue generated for first year subscribers was close to $363.this has increased by 75% in one year.
However, the marketing cost for acquisition is close to $520. Looking at the past data, the brand shall have to work upon improving the from the current AOV from $80 to approx. $90. Brand is getting into Erectile Dysfunction, Mental wellness, Anxiety and Depression & Dermatology.
(Disclaimer: These are calculations made with the basis of past marketing cost, any exceptional marketing cost was not excluded from the calculations.
Scaling - With current products, category expansions & subscriptions
Marketing spend has remained at approx. 50% of the revenues. At approx. $500 of revenue forecast for the next year, marketing spends would be in the same range in terms of %age of revenue.
CPM cost will come down a bit with recession looming over the US. Many DTC brands will cut down on the spends, hence increasing the inventory for ads.
Better operations - direct impact on bottom line
The brand needs to further work on the operating expenses. For eg. The brand has spent around $10M on App, website & Internal software in the last 3 years. As a percentage of revenue this is approx. 2.5% - 3% of the revenues, which is quite high for such a large base.


